
Overview
User researchers and designers across the Geo6 came together to explore the needs and frustrations of geospatial data portal users.
We collaborated with Ordnance Survey on the guidance and best practices to address the pain points identified by the user research conducted for the Data Discoverability 2 project.
Below is a brief summary of the work carried for these two projects and the results achieved.
Data Discoverability 2
The purpose of this work stream was to evaluate the needs of data portal users when discovering and accessing spatial data. The workstream evaluated how well those needs are met. It made recommendations of ways to enhance the data portal landscape in the UK to improve the success rate of users locating and accessing spatial data.
Archetypes
We also created 6 user archetypes to summarise the user research findings. Those archetypes are:
- Story tellers and consumers
- Strategic lead
- Solution innovator
- Curious researcher
- Geo data engineer
- Non-geo data engineer
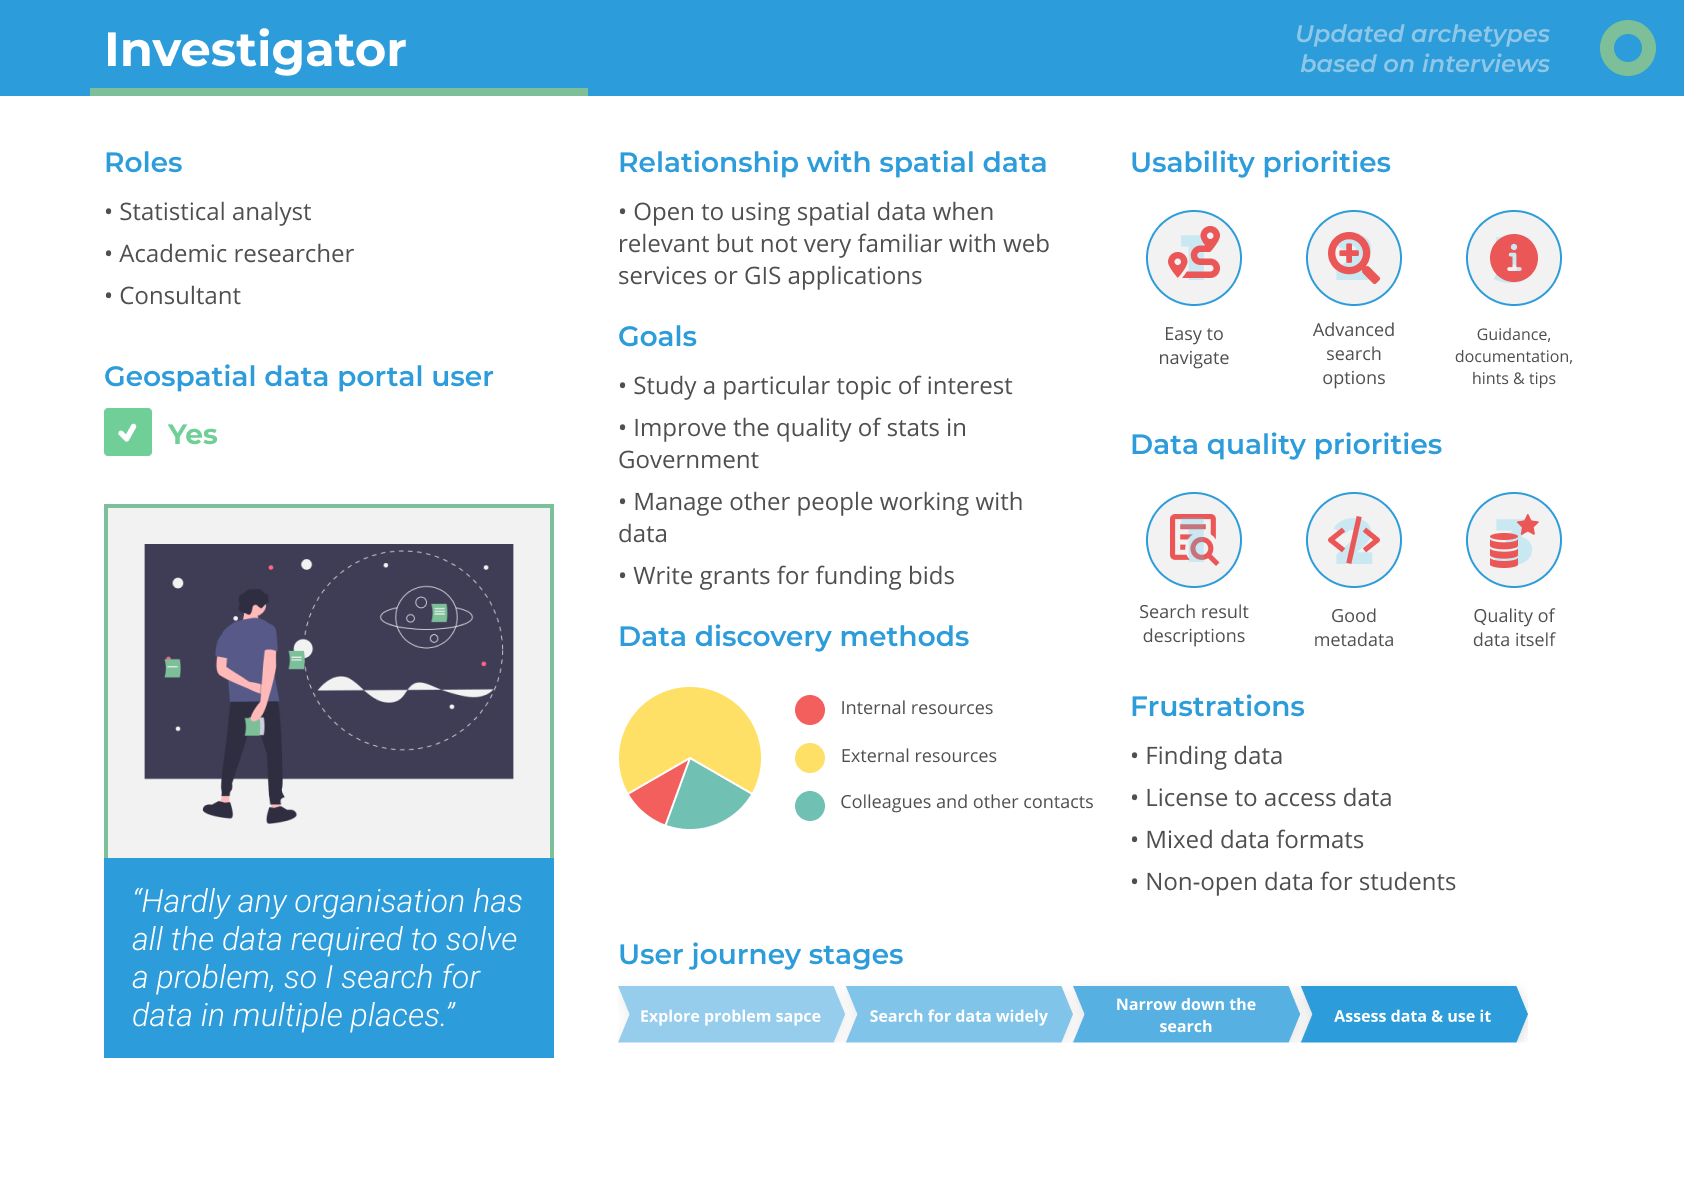 Investigator Archetype
User Journeys
User journey maps are widely used in UX to visualise how individuals complete specific tasks. These maps can take various formats and layouts, focusing on users’ thoughts, emotions, frustrations, and opportunities throughout the process to enhance usability and enjoyment. Four user journeys were crafted for spatial data experts, data experts, investigators, and solution innovators, who are active users of data portals. However, strategic leads and storytellers/consumers, who only interact with geospatial data indirectly, did not require user journeys for their use cases.
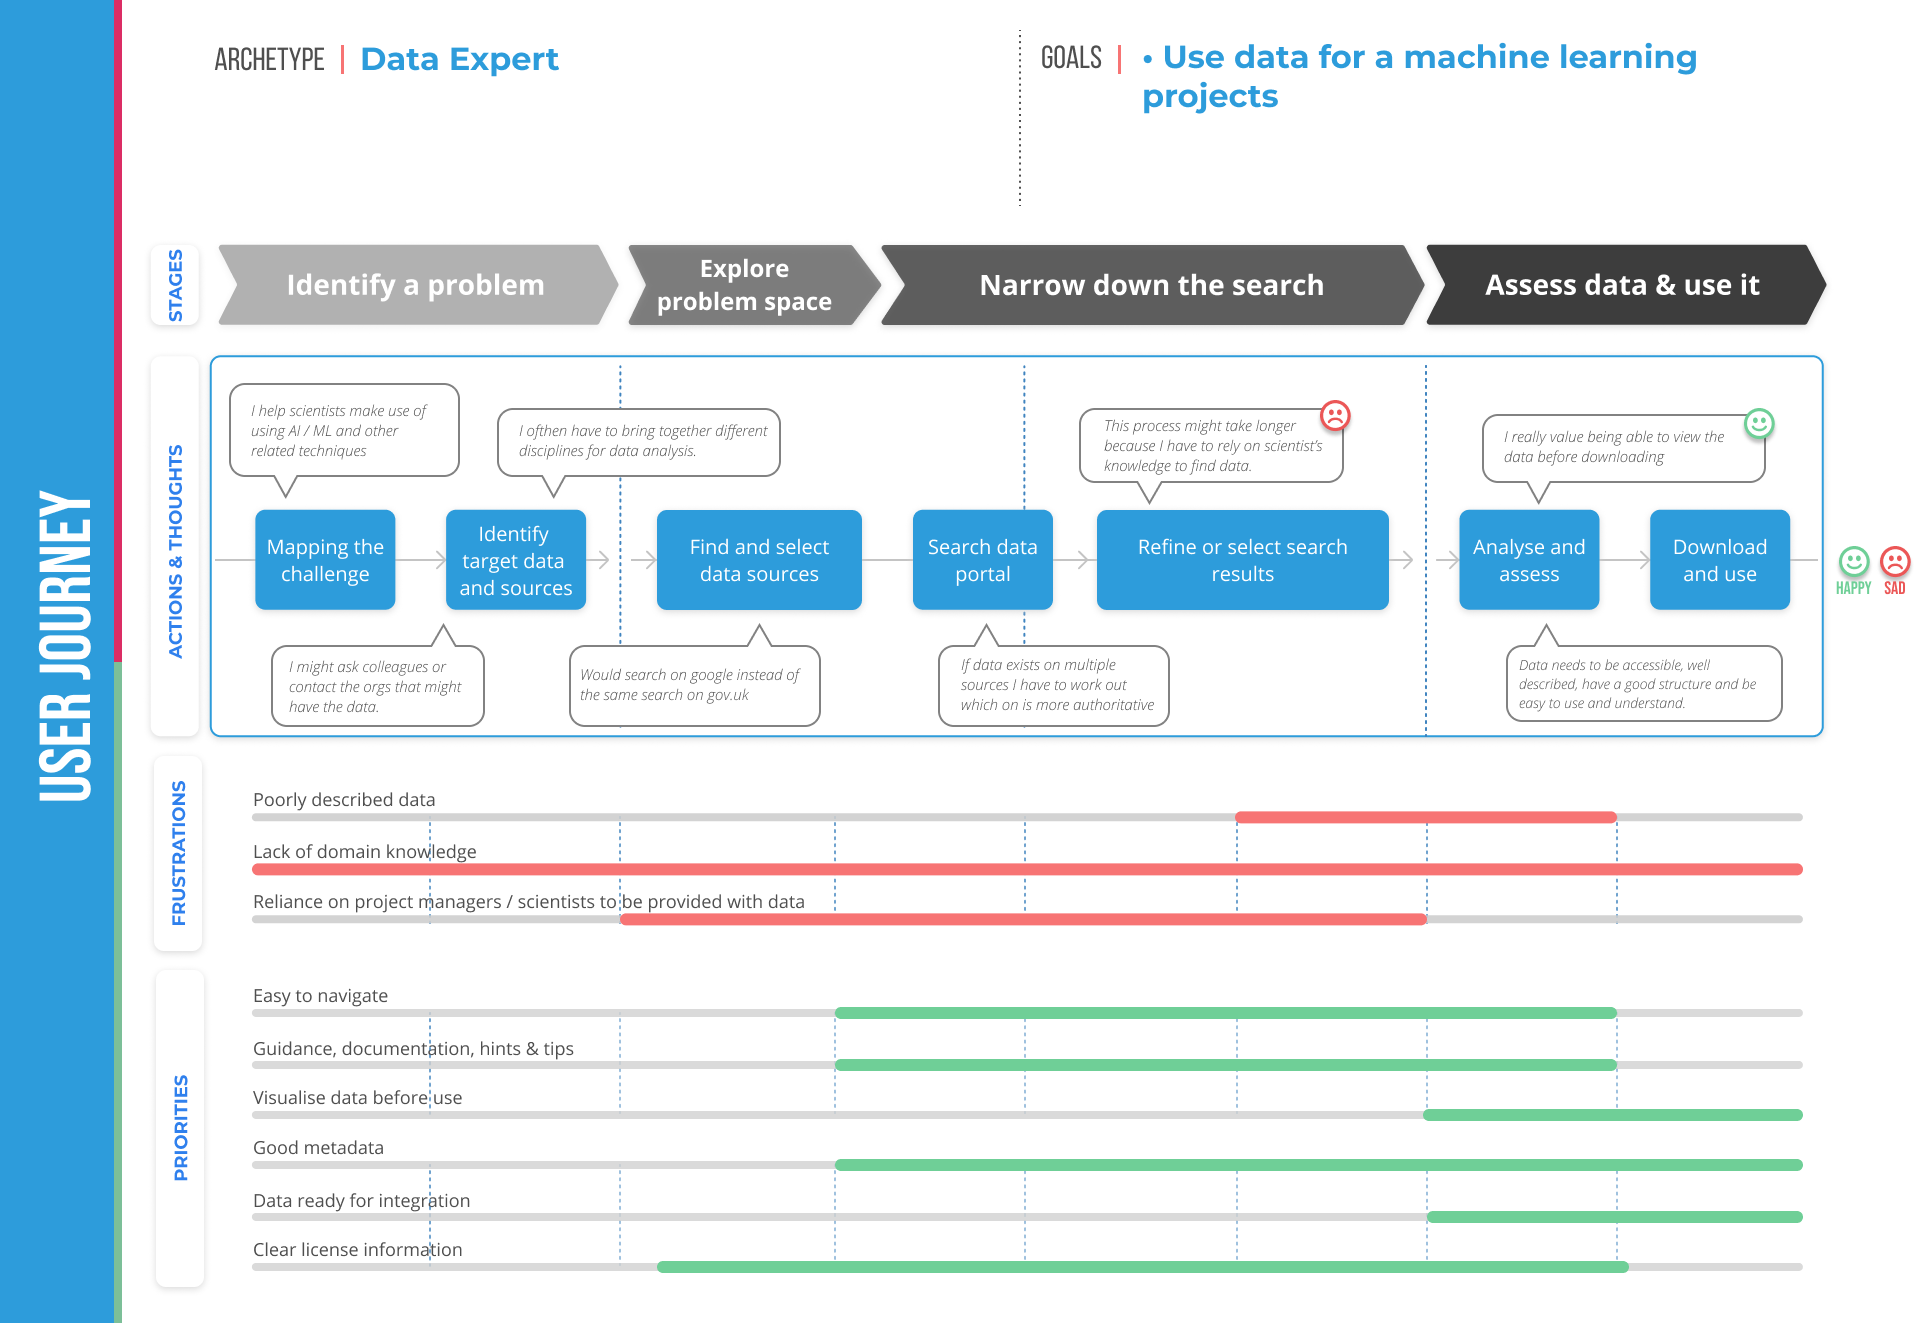 User Journey for discovering, accessing and using geospatial data portals.
Each journey map consists of:
- Goals the archetype might be trying to achieve
- The broad stages they would go through to achieve their goals
- Specific actions they would take at each stage
- The thoughts and emotions they might experience at each stage (paraphrased things people mentioned in the interviews)
- Frustrations they might experience and which stages they affect
- Top usability and data quality priorities they have and which stages they are relevant to
The broad stages of the journey for discovering spatial data are quite similar for all archetypes. They could be defined as planning, wide search, deep search and data evaluation and use. They were identified from the interview questions on how people currently find and access data and from the observation tasks where participants had to complete two data related scenarios. The interviewees didn’t give those specific names for the stages; they were inferred from the actions they were describing or taking during the tasks.
 Key stages of the journey for discovering spatial data
The planning or problem space exploration stage usually doesn’t involve data portal use yet. In this stage some people might be proactively seeking new data challenges, some might be given specific data tasks to solve.
In the wide search stage people usually rely on search engines or colleagues to get a better understanding of the available data landscape. They might find out that the data they are looking for exists on multiple sources, so they must find a way to identify which one of them is more trustworthy and better suited for their challenge.
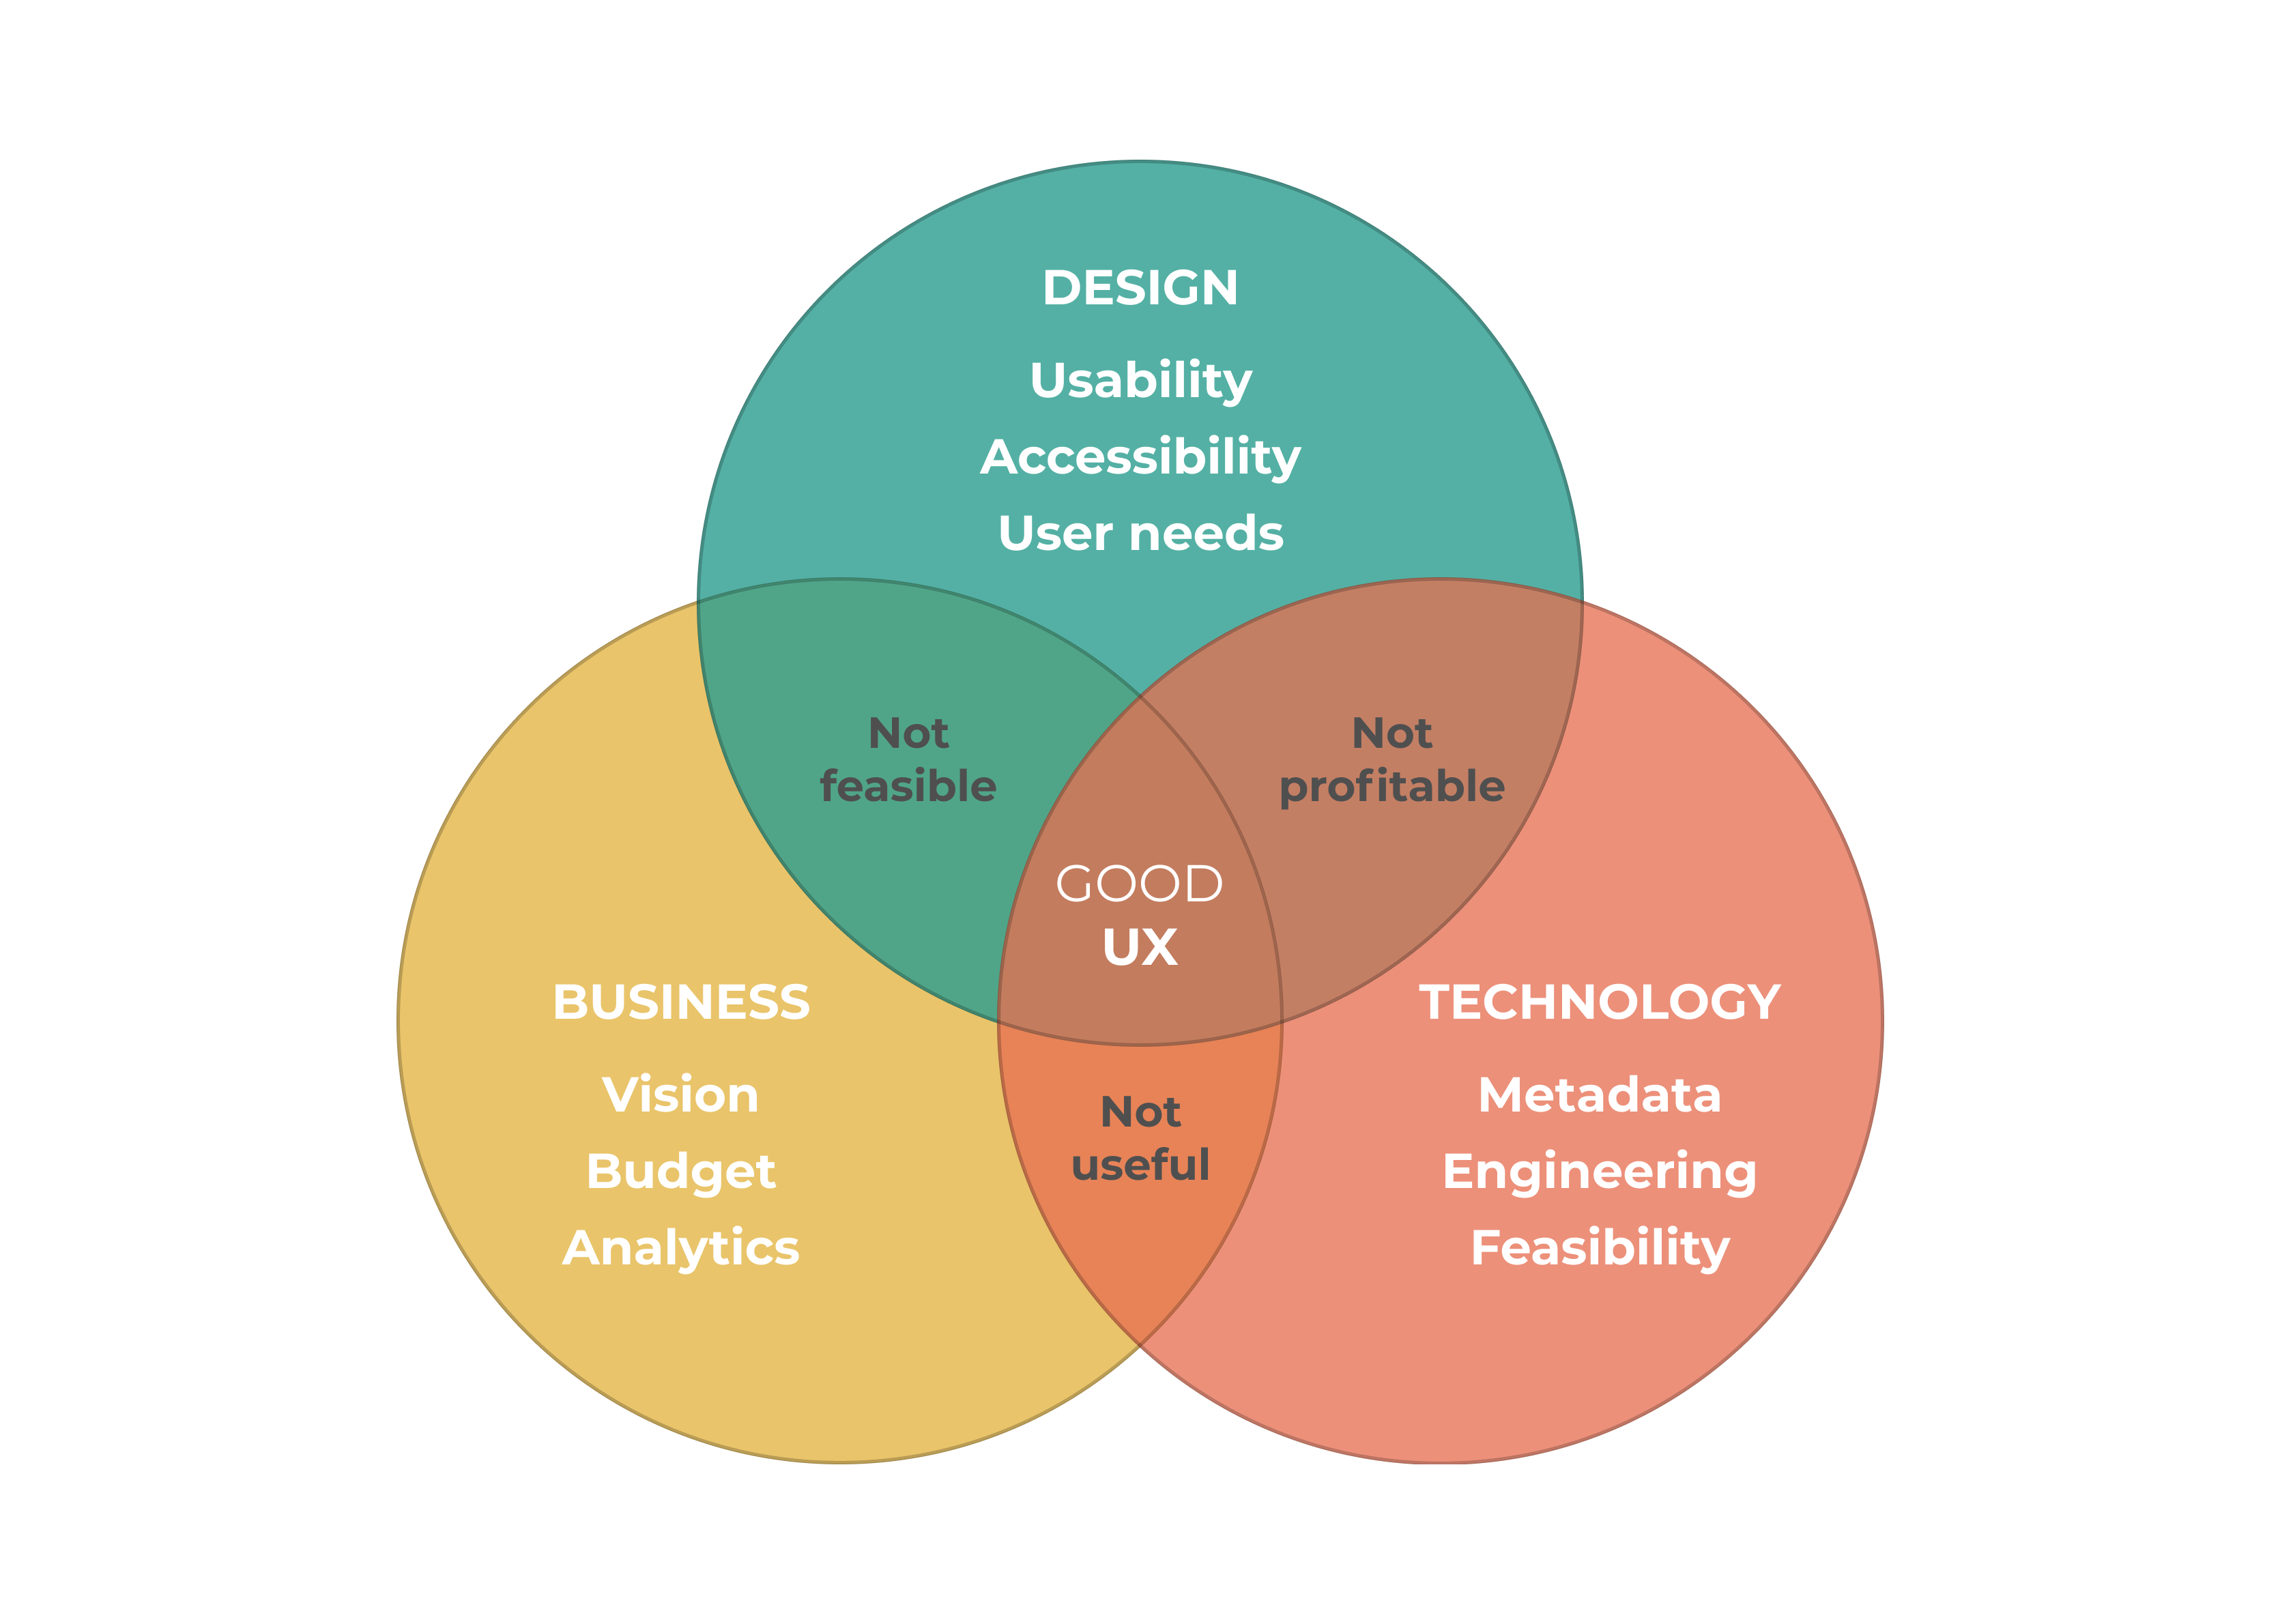 Good UX formula
Deep search stage is the place where people start using data portals in greater depth. They would identify the potential data portals that could hold the data they are looking for and they would want to narrow down the search. Data experts might spend a bit more time in the deep search stage to ensure that the data they found is the one they need, since they might not have the domain knowledge of that specific field.
The next stage – data evaluation and use – might also be done with the help of data portals. Users might want to examine the possible datasets to ensure that they have the appropriate license and meet their other requirements. There might be some extra steps of registering, purchasing or providing other details before data can be accessed. Many people mentioned that if these additional steps are too tedious it could discourage them from using the data portal or the data itself. They would also like, if possible, to visualise data in an appropriate format for its type and possibly preview a smaller sample of the whole dataset to avoid downloading large files or purchasing the wrong datasets.
Data Discoverability 3
During the DD3 project, we collaborated with Ordnance Survey’s UX team to develop design guidelines, recommendations, and wireframes specifically for geospatial portal developers and designers.
The recommendations are derived from user research findings from previous workstreams. Carl Watson has published a blog post detailing this work: